Page 1 of 2
it is frustrating!
Posted: Sun Mar 03, 2024 9:34 am
by EWUK
Hi,
on Mac runs Vensim PLE 10.1.3.
A simple model (linear growth): inflow rate-inflow-stock makes a lot of problems:
Stops from Vensim:
1. Unable to make automated backup to / uk-lin-growth.4vmfx.
2. Can't write to the file runlin.vdfx (busy or insufficient permissions). Choose another.
3. Unable to open /uk-lin.mdl for output.
Another problem: Tom Fiddeman use an i/o-tool to show a graph. But there is no i/o-tool in the Version 10.1.3.
The use of sliders shows no change in the highlighted graph (from analysis tools)?
Can you help?
Thanks
U. Küppers
Re: it is frustrating!
Posted: Sun Mar 03, 2024 2:39 pm
by Administrator
It looks like you've maybe saved the model to the root folder on your computer (which isn't allowed). Try saving to your documents folder.
Another problem: Tom Fiddeman use an i/o-tool to show a graph. But there is no i/o-tool in the Version 10.1.3.
The use of sliders shows no change in the highlighted graph (from analysis tools)?
You'll need to upload the model and provide more detail if we are going to be able to help. It could be that Vensim cannot save the results file because it does not have permission (if you saved to your root folder).
Re: it is frustrating!
Posted: Mon Mar 04, 2024 10:52 am
by EWUK
Thank you, the memory problem is solved.
How can I send an attachment with the Vensim file or an image and solve the problem why the curves in the graphics tool (from analysis tolls) do not change when changing the sliders?
Best wishes
U. Küppers
Re: it is frustrating!
Posted: Mon Mar 04, 2024 11:31 am
by Administrator
EWUK wrote: ↑Mon Mar 04, 2024 10:52 amHow can I send an attachment with the Vensim file or an image and solve the problem why the curves in the graphics tool (from analysis tolls) do not change when changing the sliders?
When posting, click the attachments button and you can attach your model.
Re: it is frustrating!
Posted: Tue Mar 05, 2024 9:47 am
by EWUK
Once more: When I use a graphic tool (from analysis tools) the curve do not change when changing a slider. Why?
Best wishes
U. Küppers
Re: it is frustrating!
Posted: Tue Mar 05, 2024 1:32 pm
by Administrator
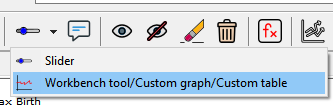
The graphic tools are "at a point in time", they will not update during SyntheSim.
But you can add a graph to the sketch, that will update during SyntheSim.
Re: it is frustrating!
Posted: Tue Mar 05, 2024 2:06 pm
by tomfid
- 2024-03-05_07-05-12.png (8.56 KiB) Viewed 2525 times
Re: it is frustrating!
Posted: Wed Mar 06, 2024 10:13 am
by EWUK
Thanks Tom,
it works, even with 2 separate diagrams of the model (state + inflow).
Last question about the graphs:
how can several curves from one diagram be represented in one graph?
Best regards
U. Küppers
Re: it is frustrating!
Posted: Thu Mar 07, 2024 11:51 am
by Administrator
You need a custom graph. Open the control panel (button near right of the top toolbar), one of the tabs allows you to create a custom graph with more than one variable.
Re: it is frustrating!
Posted: Fri Mar 08, 2024 10:40 am
by EWUK
Thanks a lot, it works.
U. Küppers
Re: it is frustrating!
Posted: Sat Mar 09, 2024 1:01 pm
by EWUK
Another little problem:
The scetch "savings" from PlE quick ref. are going well.
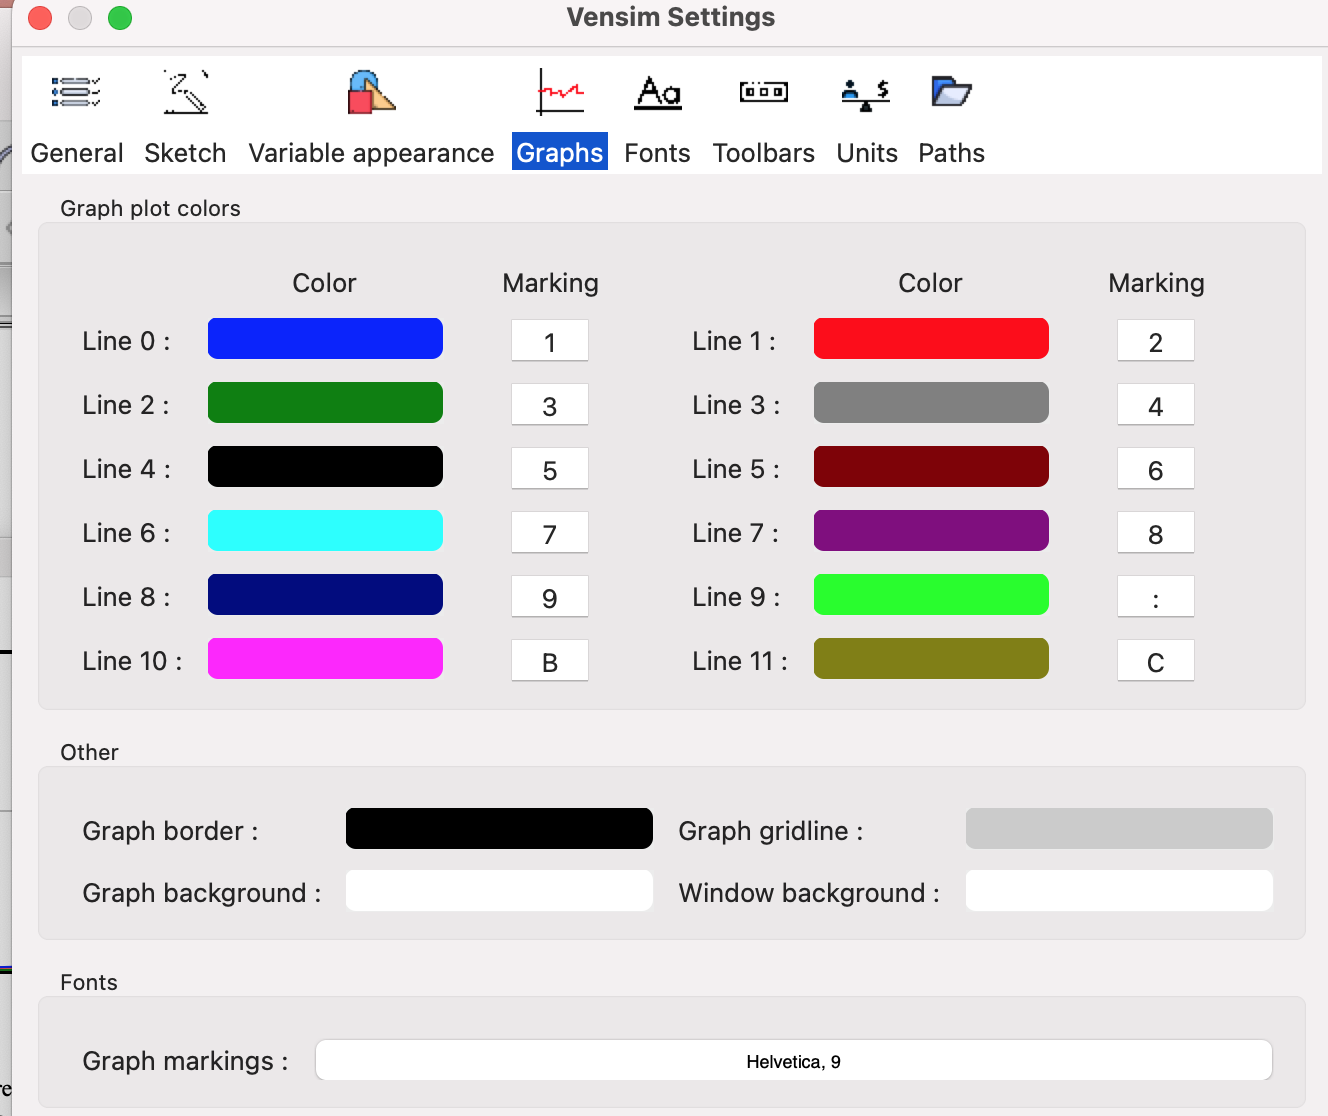
The problem is: How can the 2 lines in the graph be marked with the numbers 1 and 2?
On the corresponding photo, colour and markings are indicated, but no OK button
for inserting the numbers 1+2 for the two lines.The lines remain without numbering.
Greetings
U. Küppers
Re: it is frustrating!
Posted: Sat Mar 09, 2024 1:23 pm
by Administrator
Click the Options menu on the graph, then "Number lines".
Re: it is frustrating!
Posted: Sat Mar 09, 2024 1:32 pm
by EWUK
One adding question to the last:
Why do the 4 curves in the graph not react to the slider variation of "interest rate"?
Greetings
U. Küppers
Re: it is frustrating!
Posted: Sat Mar 09, 2024 3:51 pm
by Administrator
EWUK wrote: ↑Sat Mar 09, 2024 1:32 pm
One adding question to the last:
Why do the 4 curves in the graph not react to the slider variation of "interest rate"?
Greetings
U. Küppers
It's impossible to say as you haven't uploaded the model.
Re: it is frustrating!
Posted: Sun Mar 10, 2024 9:41 am
by EWUK
Hi,
It is a problem if some of the images and texts in VENSIM HELP are completely outdated and do not correspond with the new V PLE 10.1.3!
This is the case with the number labelling of curves. See sketch and pictures. Scetch curves don´t react by slider!
Regards
U. Küppers
- actual picture.png (176.05 KiB) Viewed 2378 times
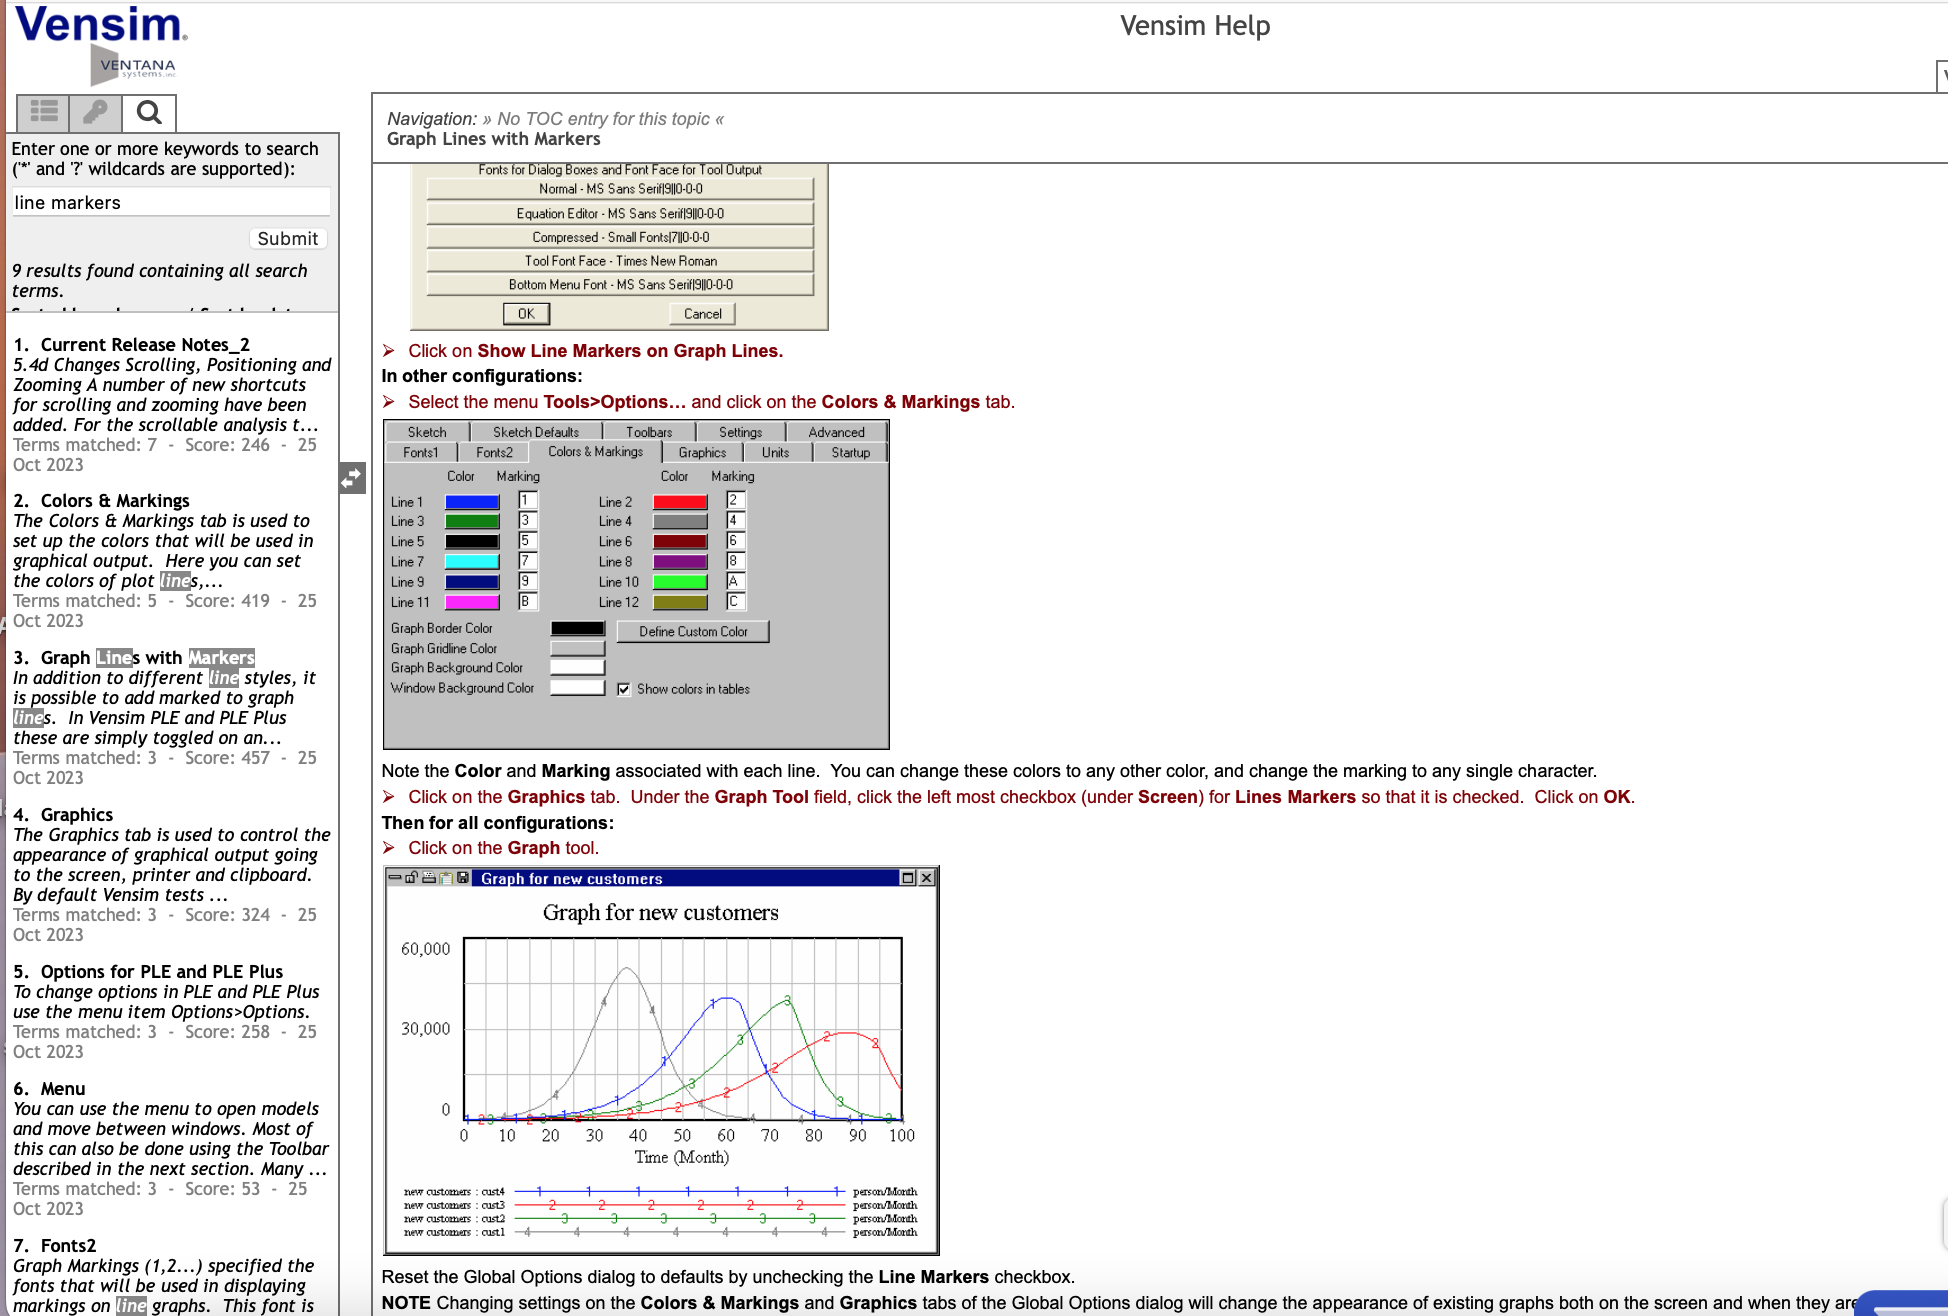
- old picture in VENSIM HELP!.png (505.58 KiB) Viewed 2378 times
Re: it is frustrating!
Posted: Sun Mar 10, 2024 12:32 pm
by EWUK
Hi,
once more a problem with "graph" from analysis tool and set a custom graph in "control panel". After clicking the "input/output" button in scetch tool and setting "custom graph", the correct name "coffee run" appears.
But when I try to push the button "test output" in control panel (graph set controls (a/e-edit), there is no graph recognisable. Where is the problem?
Regards
U. Küppers
Re: it is frustrating!
Posted: Mon Mar 18, 2024 6:57 am
by EWUK
Hi,
What concrete solution steps
can I expect for my last two problems?
Greetings U. Küppers
Re: it is frustrating!
Posted: Mon Mar 18, 2024 8:37 am
by Administrator
Same answer as before, it's impossible to say anything as you haven't uploaded the model. We cannot possibly know why the lines are not moving without seeing the model.
Re: it is frustrating!
Posted: Tue Mar 19, 2024 7:54 am
by EWUK
Hi,
1. there is a problem with the function under "plant growth", I can´t solve.
2. How can the three curves for population, environmental pollution and plants with coordinates be plotted in one graph
and varied by sliders?
Thanks
U. Küppers
Re: it is frustrating!
Posted: Tue Mar 19, 2024 12:01 pm
by Administrator
EWUK wrote: ↑Tue Mar 19, 2024 7:54 am1. there is a problem with the function under "plant growth", I can´t solve.
You used "[" and "]" for brackets, you cannot do that unless working with subscripts. Change the equation to
growth rate*consumption level*Environmental pollution*(1-(consumption level*Environmental pollution/consumption aim))
EWUK wrote: ↑Tue Mar 19, 2024 7:54 am2. How can the three curves for population, environmental pollution and plants with coordinates be plotted in one graph and varied by sliders?
You can select all three and use the graph tool. Or create a custom graph with all three plots.
The model does not run for me (floating point error).
I'd suggest adding units for all your variables in the model before you do anything else. Then someone like me might be able to help fix the floating point error.
Re: it is frustrating!
Posted: Wed Mar 20, 2024 11:54 am
by EWUK
Hi,
The model: "coupled submodels 1-3" works with adding units and other corrections. Thanks.
But one last question:
I cannot change the custom graphs "mini world" by using sliders.
Somethink is missing. But what?
regards
U. Küppers
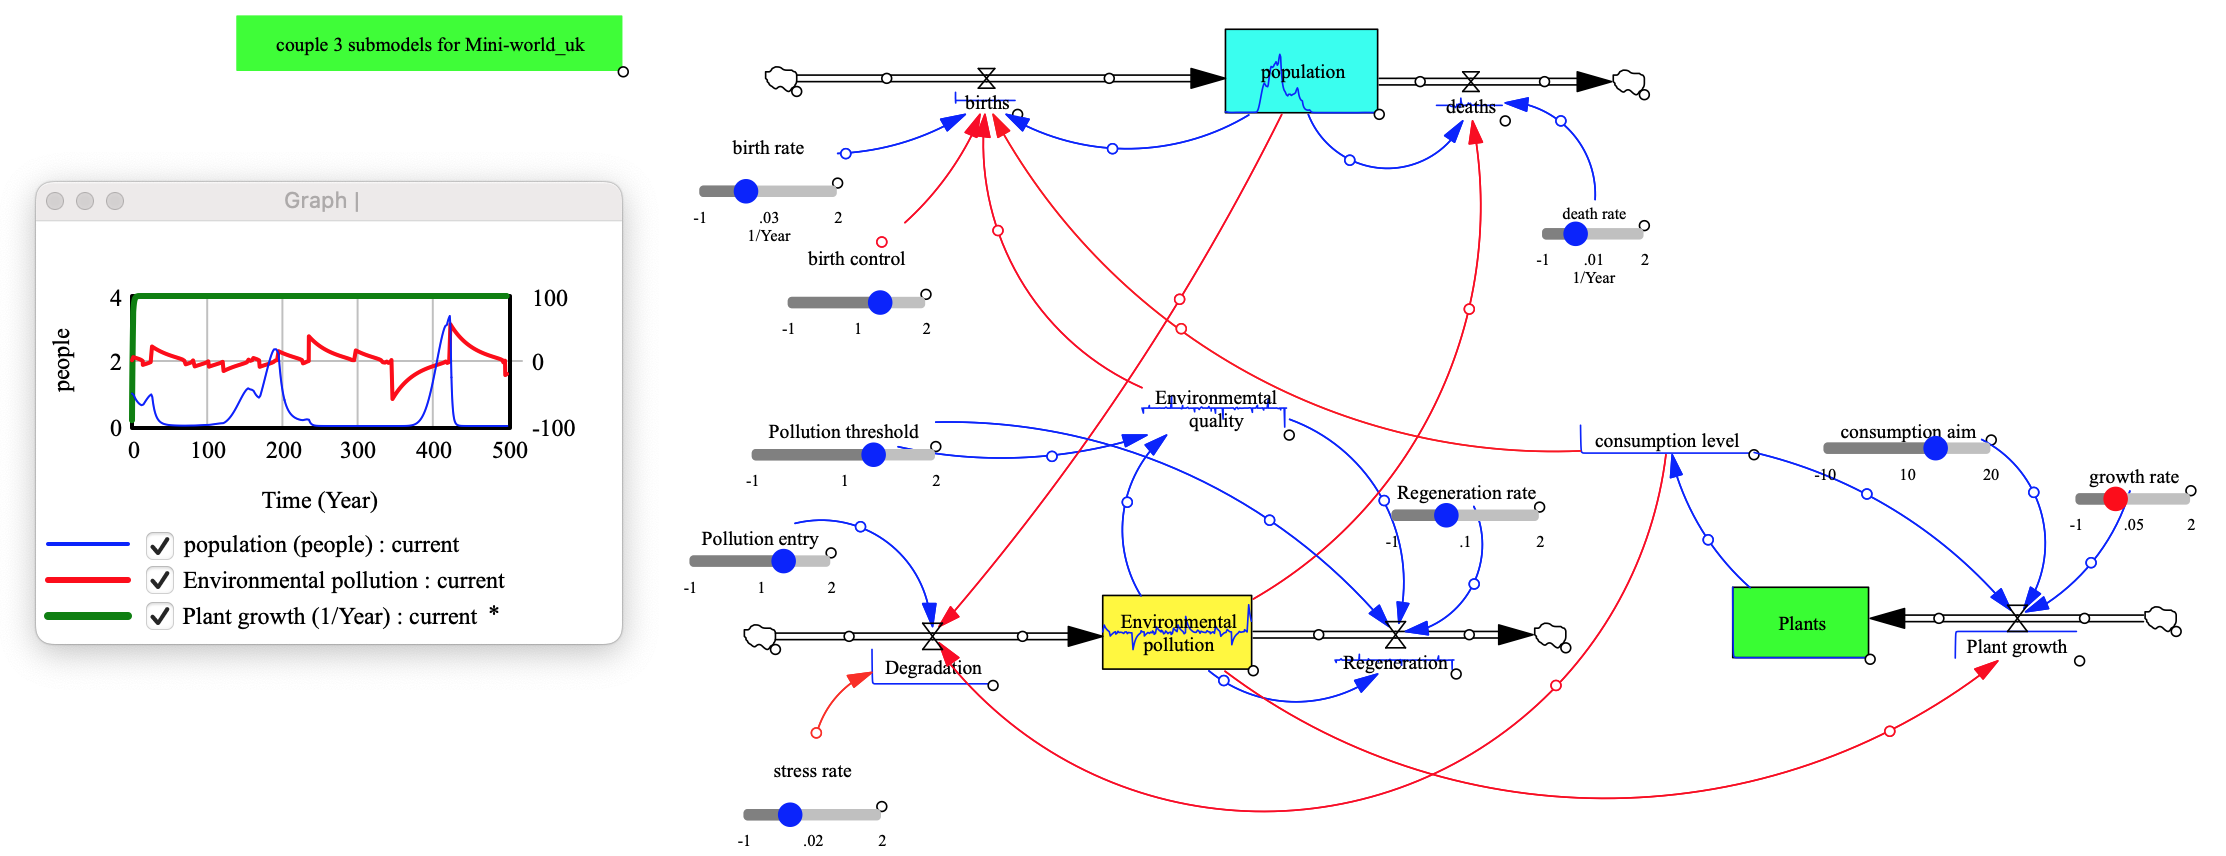
- Bildschirmfoto 2024-03-20 um 12.34.28.png (359.61 KiB) Viewed 2251 times
Re: it is frustrating!
Posted: Thu Mar 21, 2024 1:11 am
by tomfid
Is the run "current" the first loaded dataset?
Re: it is frustrating!
Posted: Thu Mar 21, 2024 7:25 am
by EWUK
Hi Tom,
yes, "current" is the first loaded dataset. I changed the run-name but nothing happens!
Perhaps a setting is missing in control panel?
Regards U. Küppers
Re: it is frustrating!
Posted: Thu Mar 21, 2024 9:17 am
by Administrator
Try the attached.
Re: it is frustrating!
Posted: Fri Mar 22, 2024 8:14 am
by EWUK
Thanks for the solution (3 curves in one graph). It works.
But for my understanding its better to know: What dit you concret change, so that the graph with 3 curves runs?
Regards U. Küppers