Page 1 of 1
table slider and graph
Posted: Thu Feb 14, 2013 6:13 pm
by kai wang
Hi Tony,
Would you please help me to deal with the following problems:
1. How can I make a table (output time series) to display the value with comma? (the table always display a unmber like: 25000000, I want it to display the number like:25,000,000)
2. How can I suppress the display of the current time step output in a table and graph? (For example, when you run the simulation of 2010, sable will display the results in the table or graph for 2010 and 2011, even though I did not run the simulation for 2011 yet)
3. I have made a slider(with value 0 to 1) to use it as a switch(0 means off,1 means on), I want this slider can only be used once in each game, that means when I turn it on (slid it to 1), it cannot be used anymore (it can became gray or just disappeared...). Is there any way to do that?
Thanks a lot!
Re: table slider and graph
Posted: Fri Feb 15, 2013 2:59 pm
by Administrator
Can you upload the screens you are trying to modify and I'll take a look?
Re: table slider and graph
Posted: Fri Feb 15, 2013 4:46 pm
by kai wang
Hi Tony,
Thanks for your reply.
The screen of "Result Summary_budget and expenditure" represents the first and second problem. In this screen, I want the table to display values with comma (first problem); I also do not want the table to show the results of 2019(current year), because I didn't run the simulation for this year (second problem).
The screen of "Policy Selection_water management" represents the third problem. In this screen, I want the player can only build a dam and reservoir one time in each game (slid the slider from 0 to 1, and then disable this slider).
Thanks!
Re: table slider and graph
Posted: Sat Feb 16, 2013 10:29 am
by Administrator
ok, the thousands is easy, see
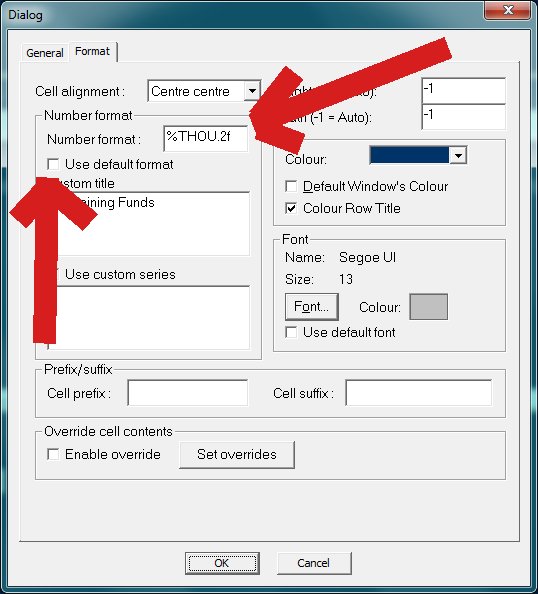
- Image1.jpg (53.98 KiB) Viewed 13463 times
Can you give me instructions on how to get to the 2nd problem (what do I click to get the error to appear)?
3rd problem. Create a directory called "Scripts" in your project directory. Save the file extprog.vst in there. Now load up the screen that I've also attached. When the slider is moved, the script is called and the value is checked. If it is 1, the slider is disabled.
Re: table slider and graph
Posted: Sat Feb 16, 2013 7:38 pm
by kai wang
Hi Tony,
The first problem is Ok now.
For the second one, let me put it in this way. If I start a game (annual time step), the first year is 2013 and the last year is 2028. I run the first year simulation(2013), sabel will give me the results of 2013 and 2014, even thoug I did run the 2014 simulation(second problem.jpg). Next, I run 2014 simulation, then the results of 2014 will be changed according to my simulation and the results of 2015 will also represent. Vensim also does it in the same way, I made a simple vensim model to explain this problem(second problem.mdl). You can run this model in the game mode to see the problem.
For the third one, I tried what you told me but it didn't work. I am not sure if I did correctly, I saved a picutre of the project workspace,please take a look.
Re: table slider and graph
Posted: Mon Feb 18, 2013 11:13 am
by Administrator
I really do not understand what the 2nd problem is. You mention that you run it until 2014 and it shows the results, that is what it should do.
Did you use the screen I uploaded to only allow the setting of the slider once?
Re: table slider and graph
Posted: Mon Feb 18, 2013 5:55 pm
by kai wang
Hi Tony,
Based on the graph of the second problem, the current year is 2014, that means I am standing at the begining of 2014 and preparing to choose some policies for this year. When I am happy with the policies that I choose for the year 2014, I will run this year's simulaion, after that I should see the results of 2014 and move to the begining of 2015(current year). The picture(second problem.jpg) was saved after I run the 2013 simulation (I did not run the simulation of 2014 yet).
I did use the screen that you sent to me and found that there is no difference from my original screen. Are you sure you sent the edited version to me?
Best,
Kai
Re: table slider and graph
Posted: Mon Feb 18, 2013 8:05 pm
by tomfid
I think this is just a difference between continuous and discrete time thinking.
You could try creating a TIME BASE that's shifted one year for display purposes, or switch to the Diff integration method, which changes the timing of display of stocks vs. flows.