Page 1 of 1
Values Bar Graph
Posted: Fri Feb 19, 2016 3:55 pm
by klaus
Hi,
i have a question about creating a Bar Graph.
The inital time of the model is 2015, the final time is 2030, the TIME STEP is 1.
Now i would like to see in the Bar Graph only the values in 2015, 2020, 2025, 2030; and
not after every TIME STEP.
Thanks for your support.
Klaus
Re: Values Bar Graph
Posted: Fri Feb 19, 2016 5:57 pm
by Administrator
There is no way to do it.
You could try creating a variable that was similar to
value to plot = if then else ( time = 2010 :or: time = 2015 :or: time = 2020, value , :NA: )
It should ignore the NA values.
Re: Values Bar Graph
Posted: Sat Feb 20, 2016 11:42 am
by klaus
Hi,
many thanks for your quick reply.
In Vensim it works, but it does not work in Sable.
In the Sable Chart the values are assigned wrongly to the time axis.
Time axis in Vensim: 2015 / 2020 / 2025 / 2030
Time axis in Sable: 2015 / 2016/ 2017 / 2018
Best regards
Klaus
Re: Values Bar Graph
Posted: Sat Feb 20, 2016 4:08 pm
by Administrator
Can you upload or send me the screen and I'll check?
Re: Values Bar Graph
Posted: Sun Feb 21, 2016 7:27 am
by klaus
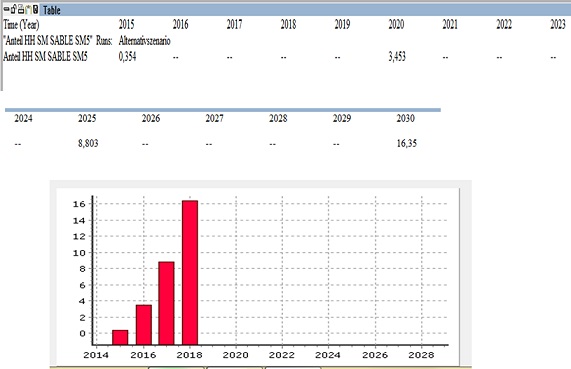
- Graph Example.jpg (44.96 KiB) Viewed 11990 times
Hi,
in the picture you can see the correct values in VENSIM and the wrong display in SABLE.
Best regards
Klaus
Re: Values Bar Graph
Posted: Sun Feb 21, 2016 7:30 am
by Administrator
Can you send or upload the VNN file? Screen shots are no use as it's impossible to recreate what you have done.
Re: Values Bar Graph
Posted: Sun Feb 21, 2016 9:26 am
by klaus
Here is the VNN File
Re: Values Bar Graph
Posted: Mon Feb 22, 2016 2:29 pm
by Administrator
I've uploaded a new build which fixes this bug (click Help->Check for updates).