Page 1 of 1
Graph help.
Posted: Tue Sep 22, 2020 2:42 pm
by danguzzo
Hi,
Is it possible to represent graphs with with no lines or with horizontal lines only?
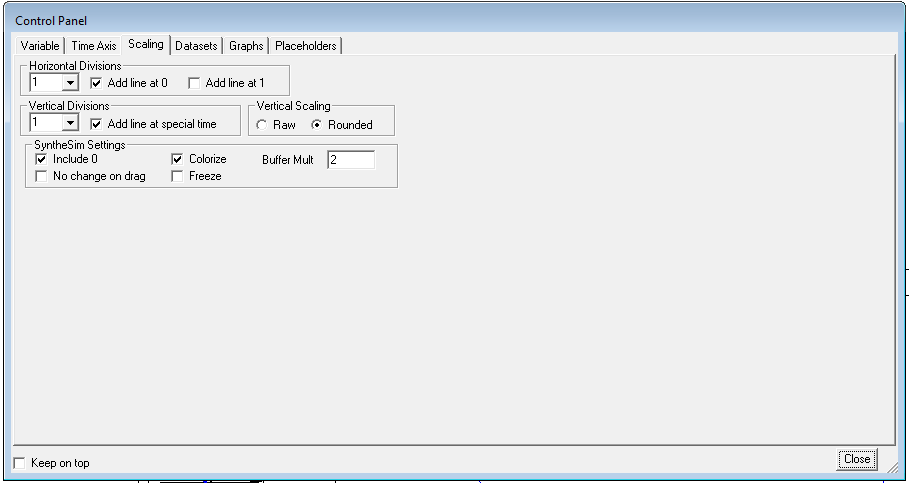
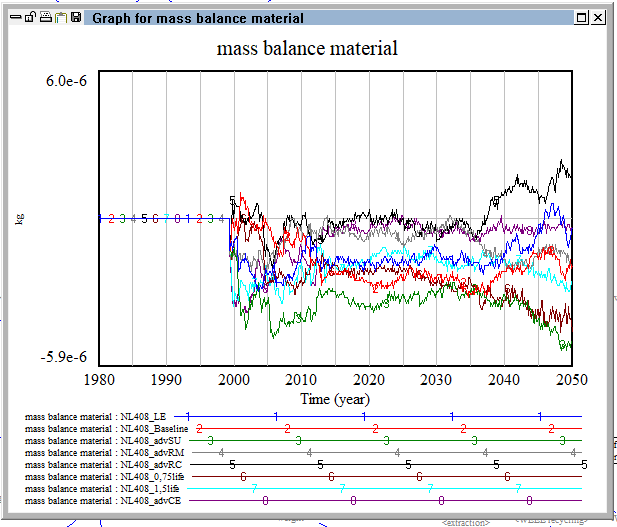
I have set according to the figure setting.png and got the result as graph.png.

- setting.png (11.37 KiB) Viewed 2367 times

- graph.png (27.37 KiB) Viewed 2367 times
It was required to keep runs numbered as well.
Many thanks,
Daniel!
Re: Graph help.
Posted: Tue Sep 22, 2020 2:52 pm
by Administrator
I'm not sure what you are asking for. The graph will show the results in the simulation, Vensim will not show a straight line if the results are not constant.
Re: Graph help.
Posted: Tue Sep 22, 2020 3:00 pm
by danguzzo
Is it possible to hide all the vertical gray lines?
Re: Graph help.
Posted: Thu Sep 24, 2020 11:06 am
by Administrator
Not at the moment. It looks like you've found a bug, I'll experiment to see if I can fix it as there should be a way of removing the lines.
Re: Graph help.
Posted: Thu Sep 24, 2020 11:42 am
by Administrator
Right click on the graph tool, and you will find a setting titled "X-Divisions". Select the "As global" option, and now your graphs should be missing the lines.
Re: Graph help.
Posted: Sun Sep 27, 2020 1:17 pm
by danguzzo
Yes, it now works! Great, thanks!